Landing Page Optimization Through Visitor Feedback
Learn how micro-surveys and exit intent feedback can dramatically improve landing page conversion rates. Data-driven optimization beyond A/B testing.
Summary
Landing page optimization typically relies on A/B testing and analytics, but these tools only tell you what happens—not why. Visitor feedback fills this gap by capturing qualitative insights at the moment of decision. This guide covers strategic feedback collection on landing pages, from exit intent surveys to scroll-triggered micro-surveys, helping you understand and address the specific concerns preventing conversion.
The Limits of Traditional Landing Page Analytics
Most teams optimize landing pages using the same toolkit: heatmaps, scroll depth, click tracking, and A/B tests. These tools reveal patterns but leave critical questions unanswered.
What Analytics Can't Tell You
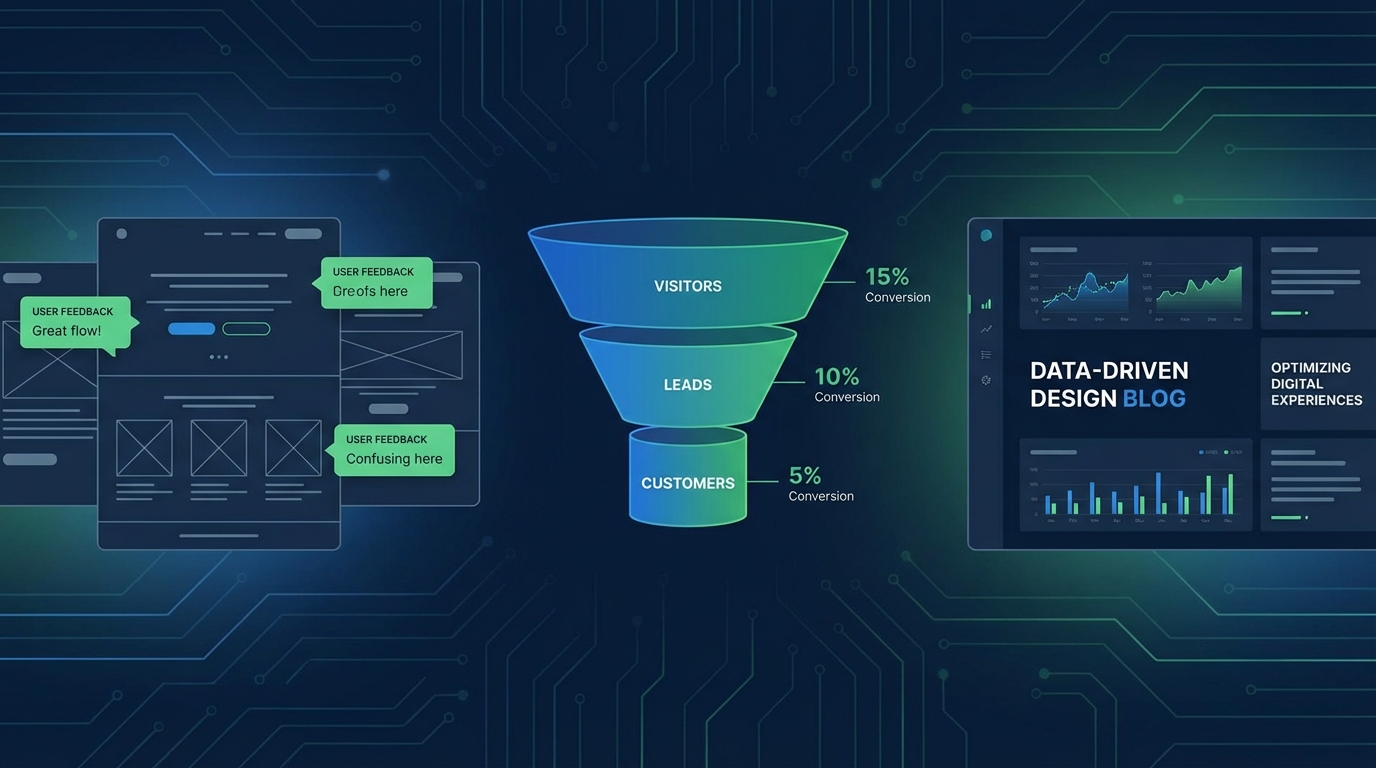
You can see that 73% of visitors leave after viewing your pricing section, but you can't know if they found it too expensive, confusing, or simply weren't ready to buy. You can measure that changing your headline increased conversions by 12%, but you can't know which aspect of the new headline resonated.
This gap between behavioral data and user intent is where optimization efforts stall. Teams run endless A/B tests, making incremental improvements without understanding the fundamental barriers to conversion.
The Feedback Advantage
Visitor feedback provides direct access to user psychology. Instead of inferring intent from behavior, you can ask visitors exactly what's holding them back. This qualitative layer transforms optimization from guesswork into targeted problem-solving.
Consider the difference:
- Analytics: 45% of visitors leave within 10 seconds
- Feedback: "I couldn't tell if this was for small businesses or enterprises"
The second insight tells you exactly what to fix.
Strategic Feedback Touchpoints on Landing Pages
Not all feedback collection is equal. Poorly timed or intrusive surveys damage the experience you're trying to optimize. Strategic placement maximizes insight while minimizing friction.
Exit Intent Surveys
Exit intent detection triggers surveys when cursor movement suggests a visitor is about to leave. This captures feedback at the critical moment of abandonment without interrupting the browsing experience.
Effective exit intent questions:
- "What stopped you from signing up today?"
- "Was there anything confusing about this page?"
- "What information were you looking for that you couldn't find?"
Best practices:
- Keep it to one question—two maximum
- Use open-ended questions for discovery, multiple choice for validation
- Show exit surveys only once per session
- Exclude visitors who've been on the page less than 10 seconds
Scroll-Triggered Micro-Surveys
Visitors who scroll deep into your page demonstrate interest. Triggering a brief survey at 70-80% scroll depth captures feedback from engaged visitors who haven't yet converted.
Sample scroll-trigger questions:
- "What's the main thing you're hoping to accomplish?"
- "How does this compare to what you're currently using?"
- "What would make you confident in signing up?"
These questions reveal buying intent and concerns while visitors are still considering your offer.
Post-Conversion Surveys
The moment after signup is perfect for understanding what drove the decision. This feedback helps you double down on what's working.
Effective post-conversion questions:
- "What convinced you to sign up today?"
- "What almost stopped you from signing up?"
- "How did you hear about us?"
The second question is particularly valuable—it reveals friction points that almost cost you the conversion.
Time-Delayed Surveys
Some visitors need time to absorb information before they can provide useful feedback. A 30-60 second delay before showing a survey allows visitors to form genuine impressions.
When to use time delays:
- Complex product pages with significant reading required
- Pages with video content
- Technical documentation or detailed comparisons
Designing High-Response Landing Page Surveys
Survey response rates on landing pages typically range from 5-15%. Design choices dramatically impact where you fall in that range.
The One-Question Rule
Every additional question reduces response rates by approximately 20%. On landing pages, where visitors haven't yet committed to your product, brevity is essential.
If you need multiple data points, rotate questions across visitors rather than asking everything at once. Over time, you'll build a complete picture without burdening individual visitors.
Question Framing Matters
How you ask affects what you learn. Compare these approaches:
Leading question: "What do you love about our product?" Neutral question: "What's your impression of our product?" Specific question: "What's unclear about how our product works?"
Leading questions generate positive but useless responses. Neutral questions generate vague responses. Specific questions generate actionable insights.
Visual Design Integration
Surveys should feel like part of your landing page, not an interruption. Match your survey styling to your brand—fonts, colors, button styles. A jarring survey design signals that feedback collection is an afterthought.
Design checklist:
- Consistent typography with your landing page
- Brand-appropriate color palette
- Clear, obvious close button
- Mobile-responsive layout
- Fast load time (under 100ms appearance)
Analyzing Landing Page Feedback
Raw feedback data requires systematic analysis to generate actionable insights. Without process, you'll drown in anecdotes.
Categorizing Feedback Themes
Review responses weekly and tag each with primary themes:
| Category | Example Feedback | Action Type |
|---|---|---|
| Pricing Concerns | "Too expensive for my budget" | Value communication |
| Feature Confusion | "Not sure if it does X" | Clarity improvement |
| Trust Issues | "Never heard of this company" | Social proof addition |
| Wrong Audience | "Looking for enterprise solution" | Targeting refinement |
| Timing | "Not ready to switch yet" | Nurture sequence |
Quantifying Qualitative Data
Track theme frequency over time. If "pricing concerns" appears in 40% of exit survey responses, that's a clear signal. If it drops to 15% after you add a comparison table showing value, you've validated the fix.
Create a simple dashboard tracking:
- Top 5 feedback themes (weekly)
- Theme trends over time
- Theme correlation with traffic source
- Theme changes after page updates
Segment-Specific Analysis
Feedback from different visitor segments reveals different insights. Break down responses by:
- Traffic source: Paid vs. organic visitors have different expectations
- Device type: Mobile visitors face different friction points
- Geographic region: Pricing concerns vary by market
- Time on page: Quick exits vs. considered abandonment
Acting on Landing Page Feedback
Insights without action are worthless. Build a systematic process for turning feedback into page improvements.
The Feedback-to-Fix Pipeline
- Weekly review: Categorize new feedback
- Prioritization: Rank issues by frequency and impact
- Hypothesis formation: "Adding social proof will address trust concerns"
- Implementation: Make the page change
- Validation: Monitor if the feedback theme decreases
Quick Wins vs. Strategic Changes
Some feedback points to easy fixes:
- "Couldn't find pricing" → Add pricing link to navigation
- "Button didn't work on mobile" → Fix responsive bug
- "Wasn't sure what you do" → Clarify headline
Other feedback requires strategic decisions:
- "Too expensive" → Pricing strategy review
- "Missing feature X" → Product roadmap consideration
- "Not for my use case" → Positioning refinement
Address quick wins immediately. Queue strategic changes for deeper discussion.
Closing the Loop
When you make changes based on visitor feedback, update your feedback collection to validate the fix. If visitors complained about confusing pricing, add a post-change survey asking specifically about pricing clarity.
This creates a continuous optimization loop:
- Collect feedback on current page
- Identify and fix top issue
- Collect feedback on fixed element
- Validate improvement
- Move to next issue
Advanced Techniques
Once basic feedback collection is running, advanced techniques can multiply your insights.
Conditional Follow-Up Questions
Based on initial responses, show relevant follow-up questions:
- Initial: "What stopped you from signing up?"
- If "pricing": "What would make the pricing feel more reasonable?"
- If "features": "Which specific feature were you looking for?"
This depth comes without burdening every visitor with multiple questions.
Cohort-Based Feedback
Run different surveys for different visitor segments:
- First-time visitors: Focus on clarity and first impressions
- Returning visitors: Focus on decision blockers
- Referred visitors: Focus on expectation matching
Integration with Session Recordings
Pair feedback responses with session recordings. When a visitor says "the page was confusing," watching their session reveals exactly where confusion occurred. This combination of stated feedback and observed behavior is powerful for diagnosis.
Measuring Feedback Program Success
Track metrics that demonstrate the value of your feedback program:
Primary Metrics
- Conversion rate improvement: Ultimate measure of optimization success
- Feedback response rate: Indicates survey design quality
- Time to insight: How quickly feedback leads to action
Secondary Metrics
- Theme resolution rate: Percentage of identified issues addressed
- Feedback-driven test win rate: A/B tests informed by feedback vs. intuition
- Visitor satisfaction scores: Post-interaction ratings
Reporting Template
Monthly reporting should include:
- Top feedback themes with example quotes
- Actions taken in response to previous feedback
- Impact of feedback-driven changes
- Recommendations for next month
Common Mistakes to Avoid
Survey Fatigue
Showing surveys too frequently annoys visitors. Implement frequency caps:
- Maximum one survey per visitor per session
- Consider cross-page caps for multi-page sites
- Respect "no thanks" responses with longer cooling periods
Confirmation Bias
It's tempting to cherry-pick feedback that confirms existing beliefs. Counter this by:
- Sharing raw feedback broadly before analysis
- Having multiple team members categorize independently
- Tracking all themes, not just expected ones
Analysis Paralysis
Endless analysis without action wastes the feedback you've collected. Set deadlines:
- Weekly feedback review (30 minutes max)
- Monthly action planning (prioritize top 3 issues)
- Quarterly program review (strategic adjustments)
Key Takeaways
- Analytics show what, feedback shows why: Combine quantitative data with qualitative insights for complete understanding
- Timing matters: Exit intent, scroll triggers, and post-conversion each capture different insights
- One question outperforms many: Brevity drives response rates on landing pages
- Categorize systematically: Theme tracking over time reveals patterns and validates fixes
- Close the loop: Every insight should lead to action, and every action should be validated
- Segment your analysis: Different visitor types have different concerns
User Vibes OS captures landing page feedback with smart timing and AI-powered analysis. Learn more.
Related Articles
Freemium to Premium: Feedback-Driven Conversion Strategies
Use targeted feedback collection to understand why free users don't upgrade, then address those barriers systematically. Convert more trials with data.
Automated Testimonial Collection: Timing and Targeting
Systematically capture testimonials by reaching happy users at the right moment. Build a testimonial engine that runs on autopilot.
Email Drip Campaigns Triggered by User Sentiment
Build smarter nurture sequences that respond to how users actually feel. Use sentiment signals to send the right email at the right moment.
Written by User Vibes OS Team
Published on January 15, 2026