User Journey Mapping: Strategic Feedback Touchpoints
Learn where to place feedback collection across the user lifecycle for maximum insight with minimum friction. A systematic approach to journey-based feedback.
Summary
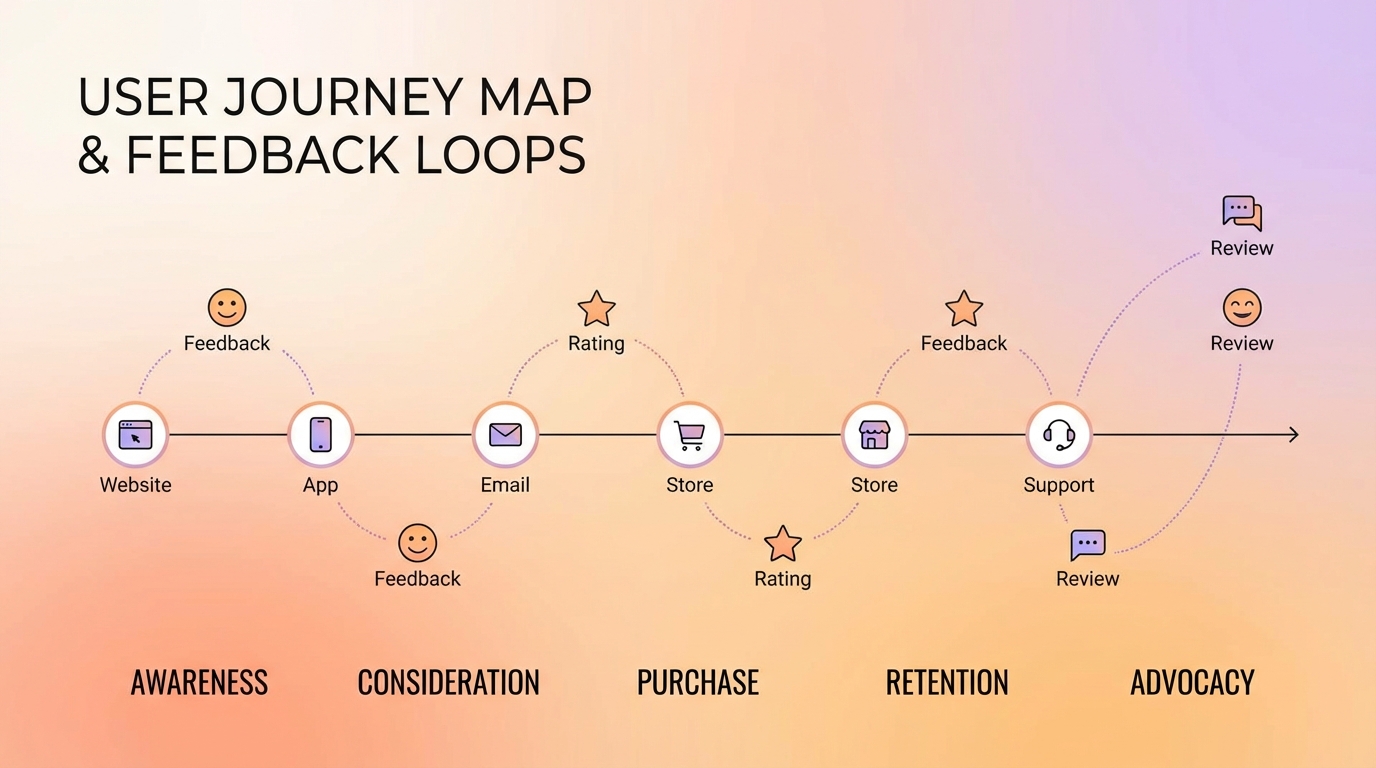
Effective feedback collection requires strategic placement across the user journey. Random surveys at arbitrary moments generate noise, not insight. Journey-mapped feedback touchpoints capture the right information at the right moments—when users can articulate experiences accurately and when the insights are most actionable. This guide covers how to map your user journey, identify optimal feedback moments, and design touchpoint-specific collection strategies.
Why Journey-Based Feedback Matters
Most companies collect feedback reactively: a survey here, a support ticket there, maybe an annual NPS blast. This approach creates fragmented data that's hard to act on.
The Problem with Ad-Hoc Collection
Scattered feedback collection leads to:
- Timing bias: You only hear from users when something goes very right or very wrong
- Context loss: Feedback disconnected from specific experiences lacks actionable detail
- Coverage gaps: Critical journey moments go unmeasured
- Survey fatigue: Users get surveyed at random, leading to declining response rates
The Journey-Mapped Advantage
Strategic touchpoint placement provides:
- Comprehensive coverage: Every critical moment has a feedback mechanism
- Contextual richness: Feedback tied to specific experiences
- Predictable cadence: Users know when to expect feedback requests
- Actionable insights: Each touchpoint answers specific questions
Mapping Your User Journey
Before placing touchpoints, you need a clear journey map.
Identifying Journey Stages
Most B2B SaaS journeys follow this general pattern:
| Stage | User Goal | Company Goal |
|---|---|---|
| Awareness | Understand if product fits need | Attract qualified visitors |
| Evaluation | Compare options, assess fit | Demonstrate value |
| Activation | Get started, first value | Drive to "aha moment" |
| Adoption | Integrate into workflow | Expand usage |
| Retention | Continue getting value | Prevent churn |
| Expansion | Get more from product | Upsell/cross-sell |
| Advocacy | Share success | Generate referrals |
Mapping Key Moments Within Stages
Each stage contains multiple moments worth mapping. For the Activation stage:
- Account creation: First impression of signup flow
- Initial setup: Configuration and customization
- First action: Creating first project/item/task
- First value: Achieving intended outcome
- First obstacle: Encountering first friction point
Identifying Emotional Peaks and Valleys
The best feedback moments often coincide with emotional intensity—both positive and negative:
Peaks (high positive emotion):
- First successful outcome
- Feature discovery that solves a pain
- Positive support interaction
- Achievement of significant milestone
Valleys (high negative emotion):
- Error or failure
- Confusion during setup
- Unmet expectation
- Support frustration
These moments generate the most honest and detailed feedback.
Designing Touchpoint-Specific Surveys
Each journey stage requires different feedback approaches.
Awareness Stage Touchpoints
Landing page exit intent:
- Single question: "What information were you looking for?"
- Goal: Understand content gaps and messaging fit
Content engagement:
- After reading case study/guide: "Was this helpful for understanding [product]?"
- Goal: Measure content effectiveness
Evaluation Stage Touchpoints
Trial signup:
- Inline during signup: "What's your main goal with [product]?"
- Goal: Understand intent for personalized onboarding
Pricing page interaction:
- If leaving without selecting: "What would help you make a decision?"
- Goal: Identify decision blockers
Feature comparison:
- After viewing comparison content: "How does [product] compare to what you're using now?"
- Goal: Competitive intelligence
Activation Stage Touchpoints
Post-setup:
- Immediately after completing setup: "How was the setup process?" (1-5 scale)
- Goal: Identify setup friction
First value achievement:
- After completing first meaningful action: "Did that go as expected?"
- Goal: Validate first experience
First obstacle:
- After detected frustration signal: "What went wrong? We want to help."
- Goal: Rapid support intervention
Adoption Stage Touchpoints
Feature discovery:
- After first use of key feature: "How useful was [feature] for your workflow?"
- Goal: Measure feature value
Weekly check-in:
- Non-intrusive pulse: "How's [product] working for you this week?" (emoji scale)
- Goal: Ongoing sentiment tracking
Usage milestone:
- At significant usage marks: "You've created 100 [items]. What's working well?"
- Goal: Understand power user patterns
Retention Stage Touchpoints
Renewal window:
- 30 days before renewal: "What would make you confident renewing?"
- Goal: Surface and address concerns proactively
Usage decline:
- When activity drops: "We noticed you haven't logged in recently. Everything okay?"
- Goal: Early churn intervention
Support resolution:
- After ticket closed: "Was your issue resolved satisfactorily?"
- Goal: Support quality measurement
Expansion Stage Touchpoints
Limit approach:
- When nearing plan limits: "Is [product] meeting your needs as you scale?"
- Goal: Identify expansion opportunities
New feature release:
- After feature announcement: "How interested are you in [new feature]?"
- Goal: Gauge expansion appetite
Advocacy Stage Touchpoints
Success celebration:
- After major achievement: "Would you be willing to share your success story?"
- Goal: Identify advocates
NPS follow-up:
- After high NPS score: "Would you like to refer a colleague?"
- Goal: Convert satisfaction to referrals
Touchpoint Design Principles
Not all touchpoints should look the same.
Matching Format to Moment
| Moment Type | Best Format | Why |
|---|---|---|
| High emotion | Open-ended | Capture rich detail |
| Quick check-in | Rating scale | Minimal friction |
| Decision point | Multiple choice | Understand specific options |
| Achievement | Single question + optional detail | Celebrate while gathering insight |
| Frustration | Support-focused | Solve problem first |
Contextual Embedding
Surveys feel less intrusive when they match the context:
In-flow embedding:
- Place survey within natural workflow pause
- "You just published your first report. How did that go?"
Contextual trigger:
- Survey appears based on specific action
- "You've used the export feature 10 times. Any improvements you'd like to see?"
Ambient collection:
- Always-available feedback widget
- Users can share when motivated, not just when prompted
Progressive Disclosure
Start simple, go deep only when users engage:
- Initial: Single emoji or rating (1 second)
- If engaged: "What's the main reason?" (10 seconds)
- If still engaged: "Any additional details?" (optional, 30 seconds)
Users who want to share more can; others provide basic signal with minimal friction.
Implementing a Touchpoint System
Moving from map to reality requires systematic implementation.
Touchpoint Inventory
Create a central registry of all feedback touchpoints:
| Touchpoint ID | Journey Stage | Trigger | Question | Owner | Last Updated |
|---|---|---|---|---|---|
| TP-001 | Activation | Setup complete | "How was setup?" | Product | 2026-01-01 |
| TP-002 | Activation | First error | "What went wrong?" | Support | 2026-01-01 |
| TP-003 | Retention | 7d inactive | "Everything okay?" | Success | 2025-12-15 |
Avoiding Survey Collision
With multiple touchpoints, users might get surveyed too often:
Frequency rules:
- Maximum one proactive survey per 7 days per user
- Reactive surveys (post-support, post-error) don't count against limit
- High-priority touchpoints can override others
- Users who've given negative feedback get cooldown period
Priority hierarchy:
- Support-related (time-sensitive)
- Churn-risk (high stakes)
- Achievement-based (high engagement moment)
- Routine check-ins (can be delayed)
Measurement Framework
Track touchpoint health:
Per-touchpoint metrics:
- Response rate (target: varies by touchpoint)
- Completion rate (target: >80% of those who start)
- Insight quality (qualitative review)
- Action rate (% of feedback leading to changes)
Cross-touchpoint metrics:
- Total survey load per user
- Journey stage coverage
- Sentiment trends by stage
Journey-Based Analysis
Touchpoint data becomes powerful when analyzed across the journey.
Stage-by-Stage Health Scores
Aggregate feedback into stage health:
Awareness:    ████████░░ 80% (content satisfaction)
Evaluation:   ██████░░░░ 60% (comparison clarity)
Activation:   █████████░ 90% (setup success)
Adoption:     ███████░░░ 70% (feature satisfaction)
Retention:    ████████░░ 80% (renewal confidence)
This view shows where the journey breaks down.
Cohort Journey Analysis
Compare journeys across user segments:
- Enterprise vs. SMB: Where do large accounts struggle vs. small?
- Self-serve vs. sales-assisted: Which onboarding works better?
- By use case: Different goals = different journey experiences?
Drop-off Point Analysis
When users churn, trace their journey feedback:
- What was sentiment at each touchpoint before churn?
- Was there a warning signal that was missed?
- Which touchpoint showed the first negative trend?
This analysis identifies intervention opportunities.
Optimizing Touchpoints Over Time
Journey mapping isn't one-and-done.
Regular Touchpoint Audits
Quarterly review each touchpoint:
Questions to ask:
- Is this touchpoint still relevant?
- Is response rate acceptable?
- Are insights still actionable?
- Has the journey changed, making this touchpoint obsolete?
Touchpoint A/B Testing
Test touchpoint variations:
- Question wording alternatives
- Different timing within the moment
- Various formats (scale vs. open-ended)
- Placement options (inline vs. popup)
Journey Evolution
As your product evolves, so does the journey:
- New features create new moments worth measuring
- Improved onboarding might eliminate friction touchpoints
- New user segments might need journey variants
Update your touchpoint map as the product changes.
Common Mistakes
Over-Surveying
The most common failure mode. Users tolerate feedback requests when they're:
- Infrequent
- Relevant to their current context
- Clearly acted upon
They reject surveys that feel like burden rather than conversation.
Ignoring Touchpoint Context
A five-star rating after signup means something different than a five-star rating after a support interaction. Analyze with context in mind.
Failing to Close the Loop
If users never see changes from their feedback, response rates decline. Show that feedback matters:
- "You asked, we built" announcements
- Individual follow-up on specific suggestions
- Visible product changelog
Static Journey Maps
User journeys evolve. A journey map from two years ago might not reflect current product reality. Treat journey mapping as ongoing work, not a one-time project.
Key Takeaways
- Map before measuring: Understand your journey before placing touchpoints
- Match format to moment: Different journey stages need different feedback approaches
- Respect user attention: Implement frequency limits and priority rules
- Analyze across stages: Individual touchpoints gain meaning in journey context
- Evolve continuously: Journey maps and touchpoints need regular updates
- Close the loop: Show users their feedback matters to maintain engagement
User Vibes OS maps feedback touchpoints across your entire user journey with intelligent timing and collision prevention. Learn more.
Related Articles
The User Journey Lifecycle: A Framework for Continuous Feedback
Discover the 9-stage user journey lifecycle for collecting feedback from attract to recapture. Build products users love with continuous insights.
Pricing Feedback Without Asking About Price: Indirect Signals That Reveal Willingness to Pay
Learn how to gauge price sensitivity through feature prioritization, value-first framing, and behavioral signals without asking users about price directly.
Building a Voice of Customer Program That Actually Influences Roadmap
Learn how to systematically collect, organize, and present user feedback so product decisions are data-driven. Includes stakeholder buy-in strategies.
Written by User Vibes OS Team
Published on January 15, 2026