Feedback-Driven A/B Testing: Qualitative Meets Quantitative
Combine user feedback with A/B test metrics to understand not just what wins, but why. Make better decisions with complete experiment context.
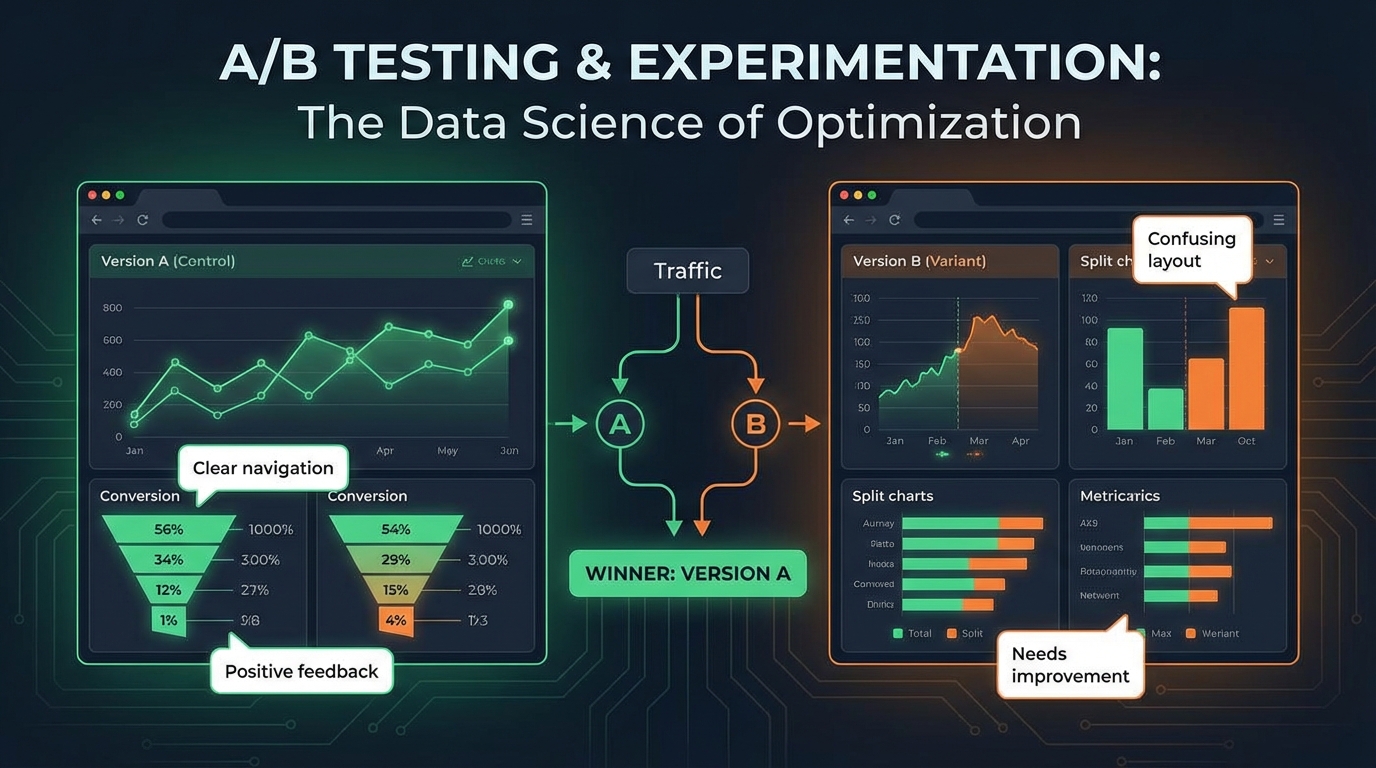
Summary
Traditional A/B testing tells you which variant wins—not why. You know Variant B increased conversions by 8%, but you don't know what users thought about it, what almost made them leave, or what would have made it even better. Integrating qualitative feedback into experimentation gives you the complete picture: what won, why it won, and how to win bigger next time. This guide covers how to design experiments that capture both quantitative metrics and qualitative insights.
The Limits of Metrics-Only Testing
A/B tests generate numbers. Numbers without context can mislead.
What Metrics Miss
The "why" behind results:
- Variant B converts 8% better—but is it the color, copy, or layout?
- Users clicked more—but were they satisfied with what they found?
- Signup increased—but will these users retain?
Unintended consequences:
- Variant B converts better but creates confused users who churn faster
- The winning copy sets expectations the product can't meet
- Higher clicks came from users who were looking for something else
Optimization ceiling:
- You know B beats A, but what would beat B?
- Metrics show the winner, not the missed opportunity
- Without feedback, optimization is incremental at best
The Feedback Advantage
Qualitative feedback fills these gaps:
- "I liked the new button but wasn't sure what would happen when I clicked it"
- "The headline made me think this was for enterprises, but I'm a small business"
- "I almost left because I couldn't find pricing"
This context transforms A/B testing from "which wins" to "why it wins and what's next."
Designing Feedback-Integrated Experiments
Plan for feedback collection from the start.
Experiment Design Framework
For each experiment, define:
Quantitative measures:
- Primary metric (conversion, click-through, etc.)
- Secondary metrics (time on page, bounce rate, etc.)
- Guardrail metrics (things that shouldn't get worse)
Qualitative measures:
- What feedback questions will be asked?
- When in the user flow will feedback be collected?
- What sample size is needed for qualitative insight?
Feedback Collection Strategies
Post-action surveys:
- After conversion: "What convinced you to sign up?"
- After bounce: "What were you looking for?"
- After engagement: "How useful was this?"
Experience-based questions:
- "How clear was this page?"
- "What almost stopped you?"
- "What would make this better?"
Comparison questions (when exposing users to both):
- "Which version do you prefer?"
- "What did you notice was different?"
Timing Feedback Collection
When you collect feedback affects what you learn:
| Timing | Strengths | Weaknesses |
|---|---|---|
| Immediate (during test) | Fresh impressions | May affect test behavior |
| Post-action | Connected to decision | Limited to converters |
| Follow-up (later) | Can assess outcomes | Memory decay |
| Exit intent | Captures abandoners | Rushed responses |
Most experiments benefit from multiple feedback touchpoints.
Variant-Specific Feedback Analysis
Link feedback directly to test variants.
Tagging Feedback by Variant
Ensure every feedback response includes:
- Experiment ID
- Variant assignment (A/B/C)
- Timestamp
- User segment
This enables variant-level analysis:
Variant A feedback themes:
- "Clean but boring" (23%)
- "Not sure what to do next" (31%)
- "Looks trustworthy" (18%)

Variant B feedback themes:
- "Eye-catching" (27%)
- "Felt rushed" (19%)
- "Clear call to action" (34%)
Sentiment Analysis by Variant
Compare sentiment scores across variants:
| Variant | Conversion Rate | Avg Sentiment | Clarity Score |
|---|---|---|---|
| A | 3.2% | 62 | 4.1/5 |
| B | 3.8% | 71 | 4.4/5 |
| C | 3.5% | 58 | 3.9/5 |
Variant B wins on both conversion AND sentiment. Variant C improved conversion but hurt sentiment—a warning sign for downstream metrics.
Theme Correlation Analysis
Identify which feedback themes correlate with conversion:
Converters said:
- "Clear value proposition" (42%)
- "Easy to understand pricing" (38%)
- "Trusted the brand" (29%)
Non-converters said:
- "Needed more information" (47%)
- "Wasn't sure about pricing" (35%)
- "Looked too salesy" (22%)
These themes become hypotheses for your next experiment.
Learning From Winners and Losers
Both successful and failed experiments teach lessons.
Analyzing Winning Variants
When a variant wins, feedback reveals:
What drove the win:
- Which specific elements resonated?
- What concerns were addressed?
- What expectations were set?
How to amplify the win:
- What would make it even better?
- What almost caused problems?
- What are users still uncertain about?
Example analysis:
Variant B won with 8% conversion lift

Positive feedback:
- "The social proof section was convincing" (mentioned 34 times)
- "Clear pricing, no surprises" (mentioned 28 times)

Improvement opportunities:
- "Would like to see a demo first" (mentioned 19 times)
- "Wasn't sure about the implementation timeline" (mentioned 15 times)

Next experiment: Add demo link or implementation FAQ to winning variant
Learning From Losing Variants
Losers contain valuable information:
Why it didn't work:
- What confused or concerned users?
- What was missing?
- What set wrong expectations?
Hidden value to preserve:
- Were there elements users loved that hurt conversion?
- Did losers have better downstream metrics?
- What worked that can be combined with the winner?
Example analysis:
Variant A lost with 5% lower conversion

Feedback revealed:
- "Really appreciated the detailed explanation" (mentioned 22 times)
- "The thorough approach made me trust them" (mentioned 18 times)

BUT also:
- "Too much text, I skimmed" (mentioned 31 times)
- "Couldn't find the signup button easily" (mentioned 27 times)

Insight: The educational content built trust but was too dense.
Next experiment: Keep the trust-building elements, improve scannability
Feedback Loops in Iterative Testing
Use feedback to design the next experiment.
The Feedback-Driven Iteration Cycle
[Experiment 1] → [Results + Feedback] → [Insight Synthesis]
       ↓                                        ↓
[Deploy Winner]                          [Hypothesis Formation]
                                                ↓
                                    [Experiment 2 Design]
                                                ↓
                                         [Experiment 2] → ...
Building a Learning Repository
Document experiment learnings systematically:
For each experiment, record:
- What we tested (hypothesis)
- What we measured (metrics + feedback)
- What we learned (quantitative + qualitative)
- What we'll test next (implications)
Example entry:
Experiment: Homepage headline test
Hypothesis: Benefits-focused headline > feature-focused headline
Results: Benefits headline +12% conversion
Feedback Insights:
- Users resonated with "Save 10 hours per week" more than feature list
- Several users mentioned they wanted to know HOW it saves time
- Trust was lower with benefits-only (perceived as "marketing speak")
Next Test: Benefits headline + mini feature preview
Avoiding Local Maxima
Metrics-only testing often gets stuck:
- Small incremental improvements
- Missing bigger opportunities
- Optimizing a flawed approach
Feedback breaks you out:
- "I wish this did X entirely differently" reveals new directions
- "This is good but not great" signals diminishing returns
- "Your competitor does Y better" opens new vectors
Advanced Techniques
Segment-Specific Analysis
Different user segments respond to variants differently:
By acquisition channel:
- Paid traffic might prefer clear value props
- Organic traffic might value detailed information
By user sophistication:
- Power users might hate simplified interfaces
- New users might be overwhelmed by complexity
By intent:
- Comparison shoppers need different information than ready-to-buy users
Collect segment data alongside feedback to identify optimal experiences per segment.
Longitudinal Feedback
Initial impressions don't always predict long-term outcomes:
Immediate feedback:
- "This looks great!"
- "So easy to sign up!"
Day 30 feedback:
- "The signup was easy but I didn't understand what I was signing up for"
- "The promises on the landing page didn't match reality"
Build feedback collection into post-conversion journey to validate that wins persist.
Contra-Metric Feedback
Sometimes ask questions that might challenge your metrics:
- "Did anything feel misleading?"
- "Did you feel pressured?"
- "Would you have preferred a different approach?"
Users might convert while feeling negative. Catching this early prevents downstream problems.
Implementation Considerations
Survey Placement and Impact
Feedback collection can affect test behavior:
Potential impacts:
- Survey presence might prime users to think critically
- Questions might introduce concepts users wouldn't have considered
- Survey friction might reduce conversion
Mitigation strategies:
- Collect feedback from subset of test population
- Use unobtrusive collection methods
- Validate that feedback collection doesn't skew metrics
Sample Size for Qualitative Insight
Qualitative analysis needs fewer responses than quantitative significance:
| Goal | Sample Needed |
|---|---|
| Theme identification | 20-30 responses |
| Theme saturation | 50-100 responses |
| Quantified theme analysis | 100+ responses |
You can reach qualitative insight before statistical significance in metrics.
Integrating Tools
Connect experimentation and feedback platforms:
Experiment platforms: Optimizely, VWO, LaunchDarkly, custom Feedback platforms: User Vibes OS, Hotjar, SurveyMonkey, custom
Integration approach:
- Pass experiment variant as metadata with feedback
- Ensure user IDs link across systems
- Build unified reporting dashboards
Organizational Adoption
Getting teams to embrace feedback-integrated testing.
Changing Experiment Culture
From: "Run test, pick winner based on metrics" To: "Run test, understand why winner won, design better test"
This requires:
- Including feedback in experiment planning
- Making time for qualitative analysis
- Valuing learning over just winning
Reporting Templates
Include feedback in experiment reports:
Standard sections:
- Hypothesis and setup
- Quantitative results
- Qualitative findings (new!)
- Combined interpretation (new!)
- Recommendations
Team Roles
Define responsibilities:
Experiment owner:
- Design feedback questions
- Analyze quantitative results
Research/insights partner:
- Analyze qualitative feedback
- Synthesize themes
Decision makers:
- Review combined findings
- Approve next experiments
Key Takeaways
- Metrics tell you what, feedback tells you why: Combine both for complete experiment understanding
- Tag feedback by variant: Enable direct comparison of qualitative experience
- Learn from losers too: Failed variants contain valuable insights for future tests
- Build iteration cycles: Use feedback to design the next experiment
- Watch for contra-indicators: Users might convert while feeling negative
- Make feedback part of experiment culture: Include it in planning, analysis, and reporting
User Vibes OS integrates feedback collection with your experimentation workflow for complete test understanding. Learn more.
Related Articles
Feedback for Developer Tools: Unique Challenges of Collecting from Technical Users
Developers hate surveys but love fixing problems. Learn how to collect actionable feedback from technical users through GitHub issues, API logs, and community channels.
Feedback During Incidents: Turning Downtime and Outages into Improvement Opportunities
How to collect and use feedback during service disruptions. Balance communication, gather impact data, and emerge with stronger customer relationships and clearer priorities.
Feature Flags Meet Feedback: Validating Releases with Real User Signals
Learn how to pair feature flag rollouts with targeted feedback collection to measure impact and catch regressions before full deployment.
Written by User Vibes OS Team
Published on January 15, 2026