Feedback Metrics That Matter: Response Rates, Quality Scores, and Actionability Benchmarks
The essential metrics for measuring feedback program health. Benchmark your response rates, assess feedback quality, and track actionability for continuous improvement.
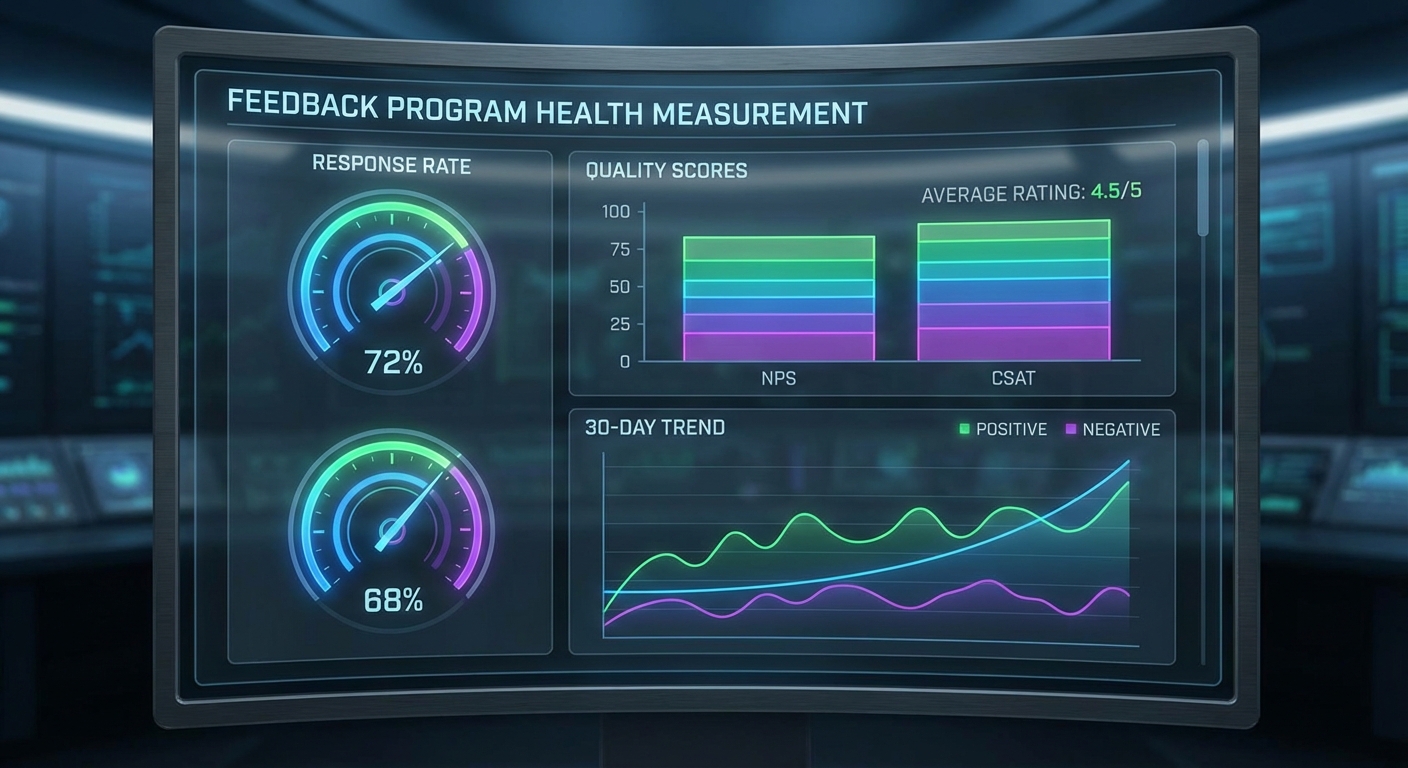
Summary
Collecting feedback is easy. Knowing if your feedback program is working is harder. Are your response rates healthy? Is the feedback you're collecting actually useful? How does your program compare to benchmarks? This guide defines the essential metrics for feedback program health, provides industry benchmarks, and shows how to build a measurement system that drives continuous improvement.
Why Feedback Needs Metrics
"We collect feedback" isn't a strategy. Measurement is.
Common Feedback Program Failures
| Symptom | Underlying Problem | Metric That Would Reveal It |
|---|---|---|
| "Users don't respond" | Wrong timing/channel | Response rate by trigger |
| "Feedback is useless" | Wrong questions | Actionability score |
| "Same issues repeat" | No feedback loop | Resolution rate |
| "Only complainers respond" | Selection bias | Sentiment distribution |
| "Can't act on it fast enough" | Volume/process mismatch | Time to process |
The Metrics Framework
Measure across four dimensions:
Volume: Are you collecting enough? Quality: Is what you collect useful? Process: Are you handling it efficiently? Impact: Is it driving outcomes?
Volume Metrics
Track feedback collection quantity.
Response Rate
Definition: Percentage of feedback requests that receive responses
Calculation:
Response Rate = (Responses Received / Requests Sent) × 100
Benchmarks by channel:
| Channel | Poor | Average | Good | Excellent |
|---|---|---|---|---|
| In-app micro-survey | < 20% | 20-30% | 30-45% | > 45% |
| In-app multi-question | < 8% | 8-15% | 15-25% | > 25% |
| Email (active users) | < 8% | 8-15% | 15-25% | > 25% |
| Email (inactive) | < 3% | 3-7% | 7-12% | > 12% |
| Post-support survey | < 15% | 15-25% | 25-35% | > 35% |
| NPS (in-app) | < 20% | 20-35% | 35-50% | > 50% |
| NPS (email) | < 10% | 10-20% | 20-30% | > 30% |
Coverage Rate
Definition: Percentage of active users who have provided feedback in a period
Calculation:
Coverage Rate = (Unique Respondents / Active Users) × 100
Benchmarks:
| Period | Poor | Average | Good | Excellent |
|---|---|---|---|---|
| Monthly | < 5% | 5-10% | 10-20% | > 20% |
| Quarterly | < 15% | 15-25% | 25-40% | > 40% |
| Annually | < 30% | 30-50% | 50-70% | > 70% |
Feedback Velocity
Definition: Number of feedback items received per time period
Tracking:
Week 1: 124 items
Week 2: 138 items (+11%)
Week 3: 142 items (+3%)
Week 4: 89 items (-37%) ⚠️
Why it matters: Sudden drops indicate collection issues. Sudden spikes may indicate incidents or campaign effects.
Segment Coverage
Definition: Response rates by user segment
Example:
Coverage by Plan - Last 30 Days
━━━━━━━━━━━━━━━━━━━━━━━━━━━━━━━━━━━━━━━
Plan        │ Users │ Responded │ Rate
━━━━━━━━━━━━━━━━━━━━━━━━━━━━━━━━━━━━━━━
Enterprise  │  450  │    167    │ 37%
Pro         │ 2,100 │    483    │ 23%
Starter     │ 5,400 │    648    │ 12%
Free        │12,000 │    480    │  4%
━━━━━━━━━━━━━━━━━━━━━━━━━━━━━━━━━━━━━━━
Why it matters: Ensures you're hearing from all segments, not just the vocal minority.
Quality Metrics
Measure feedback usefulness.
Actionability Score
Definition: Percentage of feedback that contains actionable information
Criteria for actionable:
- Specific problem described
- Clear context provided
- Potential solution suggested OR
- Clear user impact stated
Calculation:
const assessActionability = async (feedback) => {
  const criteria = {
    hasSpecificProblem: await ai.detect(feedback, 'specific_issue'),
    hasContext: feedback.contextData && feedback.contextData.page,
    hasSuggestion: await ai.detect(feedback, 'suggestion'),
    hasImpact: await ai.detect(feedback, 'impact_statement'),
  };

  const score = Object.values(criteria).filter(Boolean).length / 4;

  return {
    score,
    isActionable: score >= 0.5,
    criteria,
  };
};
Benchmarks:
| Score | Quality Level | Action |
|---|---|---|
| < 30% | Poor | Improve question design |
| 30-50% | Average | Acceptable, room for improvement |
| 50-70% | Good | Solid feedback quality |
| > 70% | Excellent | Highly actionable program |
Specificity Score
Definition: How specific and detailed is the feedback?
Scoring rubric:
- 1: Vague ("It's bad")
- 2: General ("The dashboard is slow")
- 3: Specific ("Dashboard takes 10 seconds to load on mobile")
- 4: Detailed ("Dashboard takes 10 seconds to load on mobile Safari after adding more than 5 widgets")
Benchmark: Average specificity should be > 2.5
Sentiment Distribution
Definition: Balance of positive, neutral, and negative feedback
Healthy distribution:
Sentiment Distribution - January 2026
━━━━━━━━━━━━━━━━━━━━━━━━━━━━━━━━━━━━━━━━━━━━━━━━━
Positive:  ████████████████████████░░  45%
Neutral:   ███████████████░░░░░░░░░░░  30%
Negative:  ████████████░░░░░░░░░░░░░░  25%
━━━━━━━━━━━━━━━━━━━━━━━━━━━━━━━━━━━━━━━━━━━━━━━━━
Warning signs:
-
60% negative: Something is very wrong
-
80% positive: Probably only hearing from happy users
- < 10% neutral: Question may be forcing opinions
Completeness Rate
Definition: For multi-question surveys, percentage who complete all questions
Calculation:
Completeness = (Full Completions / Survey Starts) × 100
Benchmarks:
| Survey Length | Poor | Average | Good |
|---|---|---|---|
| 3 questions | < 60% | 60-75% | > 75% |
| 5 questions | < 50% | 50-65% | > 65% |
| 10 questions | < 35% | 35-50% | > 50% |
Response Length
Definition: Average length of open-text responses
Benchmarks:
| Channel | Poor | Average | Good |
|---|---|---|---|
| In-app | < 10 words | 10-25 words | > 25 words |
| < 20 words | 20-50 words | > 50 words | |
| Post-support | < 15 words | 15-35 words | > 35 words |
Note: Longer isn't always better. Context matters.
Process Metrics
Measure operational efficiency.
Time to First Response
Definition: Average time from feedback submission to acknowledgment
Benchmarks:
| Priority | Target | Acceptable |
|---|---|---|
| Critical (bug, outage) | < 1 hour | < 4 hours |
| High (major issue) | < 4 hours | < 24 hours |
| Medium (feature request) | < 24 hours | < 72 hours |
| Low (suggestion) | < 72 hours | < 1 week |
Processing Time
Definition: Time from submission to categorization and routing
Target: < 24 hours for 90% of feedback
Measurement:
Processing Time Distribution - January 2026
━━━━━━━━━━━━━━━━━━━━━━━━━━━━━━━━━━━━━━━━━━━━━━━━━
< 1 hour:   ████████████████████░░░░░░  42%
1-4 hours:  ████████████░░░░░░░░░░░░░░  28%
4-24 hours: ███████░░░░░░░░░░░░░░░░░░░  18%
1-3 days:   ████░░░░░░░░░░░░░░░░░░░░░░   9%
> 3 days:   █░░░░░░░░░░░░░░░░░░░░░░░░░   3% ⚠️
━━━━━━━━━━━━━━━━━━━━━━━━━━━━━━━━━━━━━━━━━━━━━━━━━
Backlog Age
Definition: Age distribution of unprocessed feedback
Target: No feedback older than 14 days unprocessed
Warning thresholds:
- 7+ days: Yellow flag
- 14+ days: Red flag
- 30+ days: Critical
Resolution Rate
Definition: Percentage of feedback with closed-loop response
Calculation:
Resolution Rate = (Feedback with Outcome / Total Actionable Feedback) × 100
Benchmarks:
| Outcome Type | Poor | Average | Good |
|---|---|---|---|
| Any response | < 50% | 50-70% | > 70% |
| Feature shipped | < 20% | 20-35% | > 35% |
| Bug fixed | < 60% | 60-80% | > 80% |
Impact Metrics
Measure business outcomes.
Feedback-to-Feature Ratio
Definition: How many feedback items inform each shipped feature?
Calculation:
F2F Ratio = Linked Feedback Items / Features Shipped
Target: > 10:1 (features should be backed by multiple signals)
Feature Validation Rate
Definition: Percentage of shipped features that receive positive post-launch feedback
Measurement:
- Survey users after feature launch
- Track adoption rates
- Monitor related support tickets
Target: > 70% positive reception
Feedback-Influenced Retention
Definition: Correlation between feedback loop closure and retention
Analysis:
const analyzeClosureImpact = async () => {
  const closedLoopUsers = await getUsers({ receivedOutcomeNotification: true });
  const noClosureUsers = await getUsers({
    submittedFeedback: true,
    receivedOutcomeNotification: false,
  });

  return {
    closedLoopRetention: calculateRetention(closedLoopUsers, 90),
    noClosureRetention: calculateRetention(noClosureUsers, 90),
    lift: calculateLift(closedLoopRetention, noClosureRetention),
  };
};

// Example result: 23% retention lift for closed-loop users
NPS Movement
Definition: Change in NPS correlated with feedback-driven improvements
Tracking:
NPS vs. Feedback-Driven Releases
━━━━━━━━━━━━━━━━━━━━━━━━━━━━━━━━━━━━━━━━━━━━━━━━━━━━━━━━━━
Month   │ Releases │ Feedback-Driven │  NPS  │ Change
━━━━━━━━━━━━━━━━━━━━━━━━━━━━━━━━━━━━━━━━━━━━━━━━━━━━━━━━━━
Oct     │    8     │       3         │  +24  │   -
Nov     │   12     │       7         │  +28  │  +4
Dec     │   10     │       8         │  +33  │  +5
Jan     │   14     │      11         │  +38  │  +5
━━━━━━━━━━━━━━━━━━━━━━━━━━━━━━━━━━━━━━━━━━━━━━━━━━━━━━━━━━
Correlation: r = 0.82 (strong positive)
Building a Metrics Dashboard
Operationalize measurement.
Executive Summary View
Feedback Program Health - January 2026
━━━━━━━━━━━━━━━━━━━━━━━━━━━━━━━━━━━━━━━━━━━━━━━━━━━━━━━━━━

VOLUME                          QUALITY
━━━━━━━━━━━━━━━━━━━━━━━━━━━━━━  ━━━━━━━━━━━━━━━━━━━━━━━━━━
Response Rate: 28% (avg: 25%)   Actionability: 58% (↑ 4%)
Coverage: 18% (target: 15%)     Specificity: 2.8/4 (↑ 0.2)
Velocity: 847/week (↑ 12%)      Sentiment: Balanced ✓

PROCESS                         IMPACT
━━━━━━━━━━━━━━━━━━━━━━━━━━━━━━  ━━━━━━━━━━━━━━━━━━━━━━━━━━
Acknowledgment: 4.2 hrs (↓)     F2F Ratio: 14:1 (↑)
Processing: 18 hrs (target)     Validation: 73% (↑ 5%)
Resolution: 72% (↑ 8%)          Retention Lift: 23%

Overall Program Health: 78/100 (Good) ↑ from 71
━━━━━━━━━━━━━━━━━━━━━━━━━━━━━━━━━━━━━━━━━━━━━━━━━━━━━━━━━━
Operational Alerts
Set thresholds for automatic alerts:
const feedbackAlerts = {
  volume: {
    responseRateDrop: { threshold: -20, period: '7d', severity: 'warning' },
    velocitySpike: { threshold: +50, period: '1d', severity: 'info' },
    coverageGap: { segment: 'enterprise', minRate: 0.25, severity: 'warning' },
  },
  quality: {
    actionabilityDrop: { threshold: 0.4, severity: 'warning' },
    negativeSentimentSpike: { threshold: 0.5, severity: 'critical' },
  },
  process: {
    backlogAge: { maxDays: 14, severity: 'critical' },
    resolutionRateDrop: { threshold: 0.5, severity: 'warning' },
  },
};
Trend Tracking
Monitor metrics over time:
Response Rate Trend - Last 12 Months
━━━━━━━━━━━━━━━━━━━━━━━━━━━━━━━━━━━━━━━━━━━━━━━━━━━━━━━━━━
     40% │
         │                               ●──●
     35% │                     ●──●──●──●
         │               ●──●──●
     30% │         ●──●──●
         │   ●──●──●
     25% │──●
         │
     20% └──────────────────────────────────────────────────
         Feb Mar Apr May Jun Jul Aug Sep Oct Nov Dec Jan

         Trend: +0.8% per month | Current: 32%
━━━━━━━━━━━━━━━━━━━━━━━━━━━━━━━━━━━━━━━━━━━━━━━━━━━━━━━━━━
Key Takeaways
-
Measure all four dimensions: Volume, quality, process, and impact together tell the complete story.
-
Response rate isn't everything: A 40% response rate with 20% actionability is worse than 25% response rate with 60% actionability.
-
Benchmark against yourself first: Industry benchmarks are guides; your improvement trajectory matters more.
-
Segment your metrics: Aggregate numbers hide segment-specific issues. Enterprise response rate may differ dramatically from free tier.
-
Track trends, not just snapshots: A single month's metrics mean less than directional movement over quarters.
-
Connect to business outcomes: The ultimate measure is whether feedback-driven improvements affect retention, NPS, and revenue.
-
Automate alerting: Set thresholds for key metrics to catch problems before they compound.
User Vibes OS provides comprehensive feedback analytics with built-in benchmarking, trend tracking, and automated alerting. Learn more.
Related Articles
AI-Powered Feedback Routing: Getting Issues to the Right Team
Use AI classification to automatically route feedback to product, support, engineering, or success teams. Eliminate manual triage and reduce response times.
Feedback Segmentation Strategies: Analyzing by Cohort, Plan, and Behavior
How to slice feedback data by user segments to uncover patterns invisible in aggregate. Turn noise into actionable insights for each customer type.
The Support Ticket Goldmine: Extracting Product Intelligence from Help Requests
Learn techniques for mining support conversations for feature gaps, UX friction, and documentation needs using AI categorization and pattern analysis.
Written by User Vibes OS Team
Published on January 13, 2026